At ValidExamDumps, we consistently monitor updates to the Salesforce ANC-301 exam questions by Salesforce. Whenever our team identifies changes in the exam questions,exam objectives, exam focus areas or in exam requirements, We immediately update our exam questions for both PDF and online practice exams. This commitment ensures our customers always have access to the most current and accurate questions. By preparing with these actual questions, our customers can successfully pass the Salesforce Implement and Manage CRM Analytics exam on their first attempt without needing additional materials or study guides.
Other certification materials providers often include outdated or removed questions by Salesforce in their Salesforce ANC-301 exam. These outdated questions lead to customers failing their Salesforce Implement and Manage CRM Analytics exam. In contrast, we ensure our questions bank includes only precise and up-to-date questions, guaranteeing their presence in your actual exam. Our main priority is your success in the Salesforce ANC-301 exam, not profiting from selling obsolete exam questions in PDF or Online Practice Test.
What can a consultant accomplish in the Predictions page of a model?
In the Predictions page of a model within CRM Analytics (formerly Einstein Discovery), users have the capability to interact with the model to see how different input values affect predictions. Here's a detailed look at what can be accomplished:
Manual Input of Predictor Values: Users can manually input or change values for predictor fields to see how these changes alter the predicted outcomes. This is especially useful for testing hypothetical scenarios and understanding how sensitive the model is to various inputs.
Real-Time Interaction: This functionality provides a hands-on way to explore the model's behavior, offering immediate feedback on how input variations impact predictions, which can help in refining the model or in training users on its application.
Scenario Analysis: By adjusting predictor values, users can conduct scenario analyses, which are crucial for strategic planning and decision-making.
A consultant is building a CRM Analytics dashboard for Universal
Containers. The consultant has enabled data sync to increase the
speed of datasets refreshing.
How often will the data on the dashboard be refreshed?
Universal Containers' sales team is looking to build a dashboard that shows the total revenue from their top 10 accounts (based on revenue) and make it dynamic with the filters of the dashboard.
Which action is required to accomplish this?
To create a dashboard showing the top 10 accounts by revenue dynamically, the best approach is to create a query that sorts the accounts in descending order by revenue and limits the results to the top 10. This query can then be used as the data source for the widget, ensuring that it dynamically adjusts based on the filters applied to the dashboard.
This method efficiently handles the task because sorting by revenue and limiting the results to 10 ensures that only the top accounts are displayed, and it remains dynamic with dashboard filters.
A CRM Analytics consultant is building a dashboard for Cloud Kicks that is embedded in a separate Lightning page called "Management Dashboard" using a CRM Analytics Dashboard Component. The system administrator and the contract manager should both have access. The system administrator is able to see the dashboard and the data, but the contract manager sees a blank Lightning page.
What is causing the issue?
Universal Containers has a dashboard for sales managers. They need to visualize the percentage of their opportunities in the pipeline in a Gauge chart. They want to customize the chart to keep track if they are below or beyond the target.
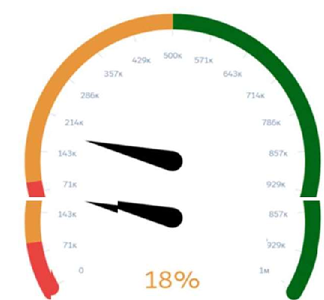
Which widget parameters should a consultant use?
In the scenario described, the sales managers at Universal Containers require a Gauge chart that not only shows the current percentage of opportunities in their pipeline but also indicates whether they are below or beyond their set targets. The appropriate widget parameters to achieve this visualization in Salesforce CRM Analytics (formerly known as Einstein Analytics) are:
Reference Line: This parameter is crucial for defining a specific target value on the gauge chart. It visually marks a point that represents the target goal, providing an immediate visual cue as to whether the current percentage is below or above this point.
Markers: Markers are used to represent and highlight specific values on the gauge chart. They can be utilized to emphasize the current percentage level of the pipeline, making it instantly visible how close or far the current value is from the reference line or target.
Conditional Formatting: This feature allows the chart to change color or style based on whether the current values meet, exceed, or fall below the target. It is a critical visual tool for quickly communicating performance against targets. Conditional formatting can be set to alter the appearance of the gauge's fill color based on whether the values are above, equal to, or below the reference line, thereby providing an intuitive visual representation of performance relative to targets.
The combination of these three parameters enables a highly effective visualization for sales managers to monitor their performance against key metrics and targets directly on their dashboards. This setup is aligned with Salesforce's best practices for creating meaningful and actionable insights within CRM dashboards, ensuring that users can easily interpret and react to the data presented.
For more details on configuring these parameters, you can refer to Salesforce documentation and specific Trailhead modules that cover dashboard creation and customization:
Building Lenses, Dashboards, and Apps in CRM Analytics
These resources provide in-depth training and examples to help users effectively use Salesforce CRM Analytics for a wide range of data visualization needs.