At ValidExamDumps, we consistently monitor updates to the Qlik QSDA2024 exam questions by Qlik. Whenever our team identifies changes in the exam questions,exam objectives, exam focus areas or in exam requirements, We immediately update our exam questions for both PDF and online practice exams. This commitment ensures our customers always have access to the most current and accurate questions. By preparing with these actual questions, our customers can successfully pass the Qlik Sense Data Architect Certification Exam - 2024 exam on their first attempt without needing additional materials or study guides.
Other certification materials providers often include outdated or removed questions by Qlik in their Qlik QSDA2024 exam. These outdated questions lead to customers failing their Qlik Sense Data Architect Certification Exam - 2024 exam. In contrast, we ensure our questions bank includes only precise and up-to-date questions, guaranteeing their presence in your actual exam. Our main priority is your success in the Qlik QSDA2024 exam, not profiting from selling obsolete exam questions in PDF or Online Practice Test.
A data architect needs to upload data from ten different sources, but only if there are any changes after the last reload. When data is updated, a new file is placed into a folder mapped to E:\486396169. The data connection points to this folder.
The data architect plans a script which will:
1. Verify that the file exists
2. If the file exists, upload it Otherwise, skip to the next piece of code.
The script will repeat this subroutine for each source. When the script ends, all uploaded files will be removed with a batch procedure. Which option should the data architect use to meet these requirements?
In this scenario, the data architect needs to verify the existence of files before attempting to load them and then proceed accordingly. The correct approach involves using the FileExists() function to check for the presence of each file. If the file exists, the script should execute the file loading routine. The FOR EACH loop will handle multiple files, and the IF statement will control the conditional loading.
FileExists(): This function checks whether a specific file exists at the specified path. If the file exists, it returns TRUE, allowing the script to proceed with loading the file.
FOR EACH: This loop iterates over a list of items (in this case, file paths) and executes the enclosed code for each item.
IF: This statement checks the condition returned by FileExists(). If TRUE, it executes the code block for loading the file; otherwise, it skips to the next iteration.
This combination ensures that the script loads data only if the files are present, optimizing the data loading process and preventing unnecessary errors.
A company needs to analyze daily sales data from different countries. They also need to measure customer satisfaction of products as reported on a social media website. Thirty (30) reports must be produced with an average of 20,000 rows each. This process is estimated to take about 3 hours.
Which option should the data architect use to build this solution?
In this scenario, the company needs to analyze daily sales data from different countries and also measure customer satisfaction of products as reported on a social media website. This suggests that the data is likely coming from different sources, including possibly an API or a web service (social media website).
The Qlik REST Connector is the appropriate tool for this job. It allows you to connect to RESTful web services and retrieve data directly into Qlik Sense. This is especially useful for integrating data from various online sources, such as social media platforms, which typically expose data via REST APIs. The REST Connector enables the extraction of large datasets from these sources, which is necessary given the requirement to produce 30 reports with an average of 20,000 rows each.
Microsoft SQL Server is not suitable for fetching data from web services or social media platforms.
Qlik GeoAnalytics is used for mapping and geographical data visualization, not for connecting to RESTful services.
Mailbox IMAP is for connecting to email servers and is not applicable to the data extraction needs described here.
Thus, Qlik REST Connector is the correct answer for this scenario.
A data architect needs to load data from two different databases. Additional data will be added from a folder that contains QVDs, text files, and Excel files.
What is the minimum number of data connections required?
In the scenario, the data architect needs to load data from two different databases, and additional data is located in a folder containing QVDs, text files, and Excel files.
Minimum Number of Data Connections Required:
Database Connections:
Each database requires a separate data connection. Therefore, two data connections are needed for the two databases.
Folder Connection:
A single folder data connection can be used to access all the QVDs, text files, and Excel files in the specified folder. Qlik Sense allows you to create a folder connection that can access multiple file types within that folder.
Total Connections:
Two Database Connections: One for each database.
One Folder Connection: To access the QVDs, text files, and Excel files.
Therefore, the minimum number of data connections required is two.
A company generates l GB of ticketing data daily. The data is stored in multiple tables. Business users need to see trends of tickets processed for the past 2 years. Users very rarely access the transaction-level data for a specific date. Only the past 2 years of data must be loaded, which is 720 GB of data.
Which method should a data architect use to meet these requirements?
In this scenario, the company generates 1 GB of ticketing data daily, accumulating up to 720 GB over two years. Business users mainly require trend analysis for the past two years and rarely need to access the transaction-level data. The objective is to load only the necessary data while ensuring the system remains performant.
Option C is the optimal choice for the following reasons:
Efficiency in Data Handling:
By loading only aggregated data for the two years, the app remains lean, ensuring faster load times and better performance when users interact with the dashboard. Aggregated data is sufficient for analyzing trends, which is the primary use case mentioned.
On-Demand App Generation (ODAG):
ODAG is a feature in Qlik Sense designed for scenarios like this one. It allows users to generate a smaller, transaction-level dataset on demand. Since users rarely need to drill down into transaction-level data, ODAG is a perfect fit. It lets users load detailed data for specific dates only when needed, thus saving resources and keeping the main application lightweight.
Performance Optimization:
Loading only aggregated data ensures that the application is optimized for performance. Users can analyze trends without the overhead of transaction-level details, and when they need more detailed data, ODAG allows for targeted loading of that data.
Qlik Sense Best Practices: Using ODAG is recommended when dealing with large datasets where full transaction data isn't frequently needed but should still be accessible.
Qlik Documentation on ODAG: ODAG helps in maintaining a balance between performance and data availability by providing a method to load only the necessary details on demand.
Exhibit.
While performing a data load from the source shown, the data architect notices it is NOT appropriate for the required analysis.
The data architect runs the following script to resolve this issue:
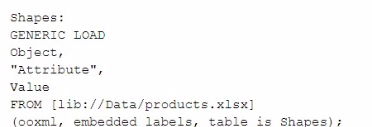
How many tables will this script create?
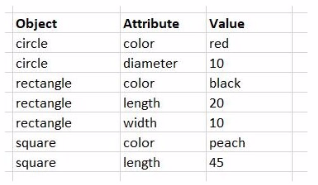
In this scenario, the data architect is using a GENERIC LOAD statement in the script to handle the data structure provided. A GENERIC LOAD is used in Qlik Sense when you have data in a key-value pair structure and you want to transform it into a more traditional table structure, where each attribute becomes a column.
Given the input data table with three columns (Object, Attribute, Value), and the attributes in the Attribute field being either color, diameter, length, or width, the GENERIC LOAD will create separate tables based on the combinations of Object and each Attribute.
Here's how the GENERIC LOAD works:
For each unique object (circle, rectangle, square), the GENERIC LOAD creates separate tables based on the distinct values of the Attribute field.
Each of these tables will contain two fields: Object and the specific attribute (e.g., color, diameter, length, width).
Breakdown:
Table for circle:
Fields: Object, color, diameter
Table for rectangle:
Fields: Object, color, length, width
Table for square:
Fields: Object, color, length
Each distinct attribute (color, diameter, length, width) and object combination generates a separate table.
Final Count of Tables:
The script will create 6 separate tables: one for each unique combination of Object and Attribute.
Qlik Sense Documentation on Generic Load: Generic loads are used to pivot key-value pair data structures into multiple tables, where each key (in this case, the Attribute field values) forms a new column in its own table.