At ValidExamDumps, we consistently monitor updates to the Nutanix NCA exam questions by Nutanix. Whenever our team identifies changes in the exam questions,exam objectives, exam focus areas or in exam requirements, We immediately update our exam questions for both PDF and online practice exams. This commitment ensures our customers always have access to the most current and accurate questions. By preparing with these actual questions, our customers can successfully pass the Nutanix Certified Associate v6.5 exam on their first attempt without needing additional materials or study guides.
Other certification materials providers often include outdated or removed questions by Nutanix in their Nutanix NCA exam. These outdated questions lead to customers failing their Nutanix Certified Associate v6.5 exam. In contrast, we ensure our questions bank includes only precise and up-to-date questions, guaranteeing their presence in your actual exam. Our main priority is your success in the Nutanix NCA exam, not profiting from selling obsolete exam questions in PDF or Online Practice Test.
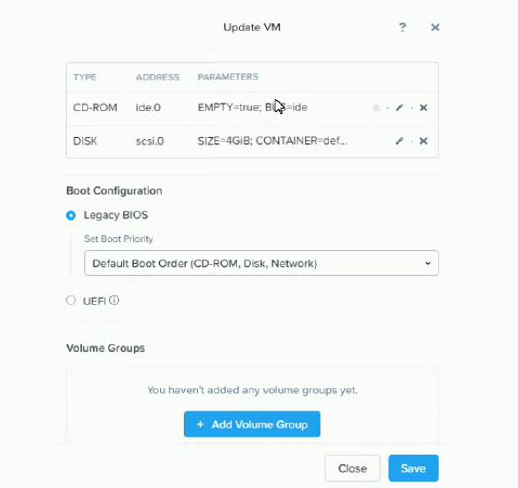
Refer to the exhibit.

A team member has built a CentOS VM image for use as a template. An administrator deploys a new VM using the CentOS image as the 05 drive. No other drives are presented to the VM.
Following the deployment, the administrator attempts to boot the VM, but is unsuccessful.
What could be causing this issue?
An administrator should use which Nutanix component to to create in-guest clustering?