At ValidExamDumps, we consistently monitor updates to the IASSC ICBB exam questions by IASSC. Whenever our team identifies changes in the exam questions,exam objectives, exam focus areas or in exam requirements, We immediately update our exam questions for both PDF and online practice exams. This commitment ensures our customers always have access to the most current and accurate questions. By preparing with these actual questions, our customers can successfully pass the IASSC Certified Lean Six Sigma Black Belt exam on their first attempt without needing additional materials or study guides.
Other certification materials providers often include outdated or removed questions by IASSC in their IASSC ICBB exam. These outdated questions lead to customers failing their IASSC Certified Lean Six Sigma Black Belt exam. In contrast, we ensure our questions bank includes only precise and up-to-date questions, guaranteeing their presence in your actual exam. Our main priority is your success in the IASSC ICBB exam, not profiting from selling obsolete exam questions in PDF or Online Practice Test.
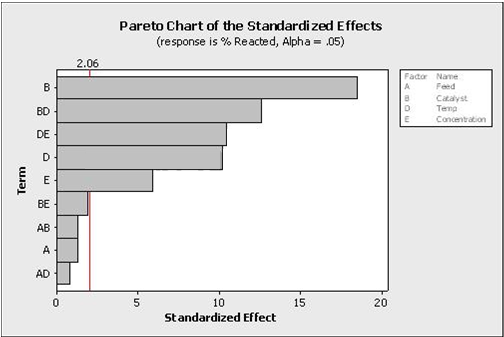
Which statement(s) are correct about the Pareto Chart shown here for the DOE analysis? (Note: There are 2 correct answers).

If a process has subgroups for Variable data and the process runs for a long period of time, then the best pair of SPC Charts to use would be an Xbar and _________.
With Measurement System Analysis we are concerned with two issues that impact the potential variability of the data. They are _____________________.
A fundamental rule is that both Standard Deviation and Variance can be added.