At ValidExamDumps, we consistently monitor updates to the Fortinet NSE7_EFW-6.4 exam questions by Fortinet. Whenever our team identifies changes in the exam questions,exam objectives, exam focus areas or in exam requirements, We immediately update our exam questions for both PDF and online practice exams. This commitment ensures our customers always have access to the most current and accurate questions. By preparing with these actual questions, our customers can successfully pass the Fortinet NSE 7 - Enterprise Firewall 6.4 exam on their first attempt without needing additional materials or study guides.
Other certification materials providers often include outdated or removed questions by Fortinet in their Fortinet NSE7_EFW-6.4 exam. These outdated questions lead to customers failing their Fortinet NSE 7 - Enterprise Firewall 6.4 exam. In contrast, we ensure our questions bank includes only precise and up-to-date questions, guaranteeing their presence in your actual exam. Our main priority is your success in the Fortinet NSE7_EFW-6.4 exam, not profiting from selling obsolete exam questions in PDF or Online Practice Test.
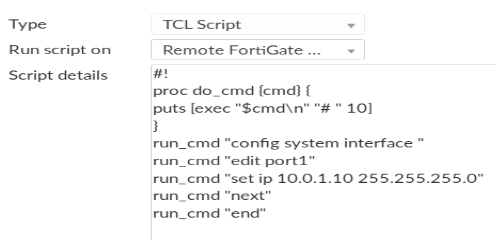
Refer to the exhibit, which contains a TCL script configuration on FortiManager.

An administrator has configured the TCL script on FortiManager, but failed to apply any changes to the managed device after being executed.
Why did the TCL script fail to make any changes to the managed device?
Examine the following traffic log; then answer the question below.
date-20xx-02-01 time=19:52:01 devname=master device_id="xxxxxxx" log_id=0100020007 type=event subtype=system pri critical vd=root service=kemel status=failure msg="NAT port is exhausted."
What does the log mean?
A corporate network allows Internet Access to FSSO users only. The FSSO user student does not have Internet access after successfully logged into the Windows AD network. The output of the 'diagnose debug authd fsso list' command does not show student as an active FSSO user. Other FSSO users can access the Internet without problems. What should the administrator check? (Choose two.)
Which of the following statements are true regarding the SIP session helper and the SIP application layer gateway (ALG)? (Choose three.)
Refer to the exhibit, which contains the output of diagnose sys session list.

If the HA ID for the primary unit is zero (0), which statement about the output is true?